I am a big fan of Symplur and the service they provide through their healthcare hashtag project for those of us interested in the health conversations which take place on Twitter. For over 2 years, Symplur has collected health conversations on Twitter and analyzed them across thousands of variables. The result is produced in this video, a visual representation of c. 2,000 different health communities or topics.
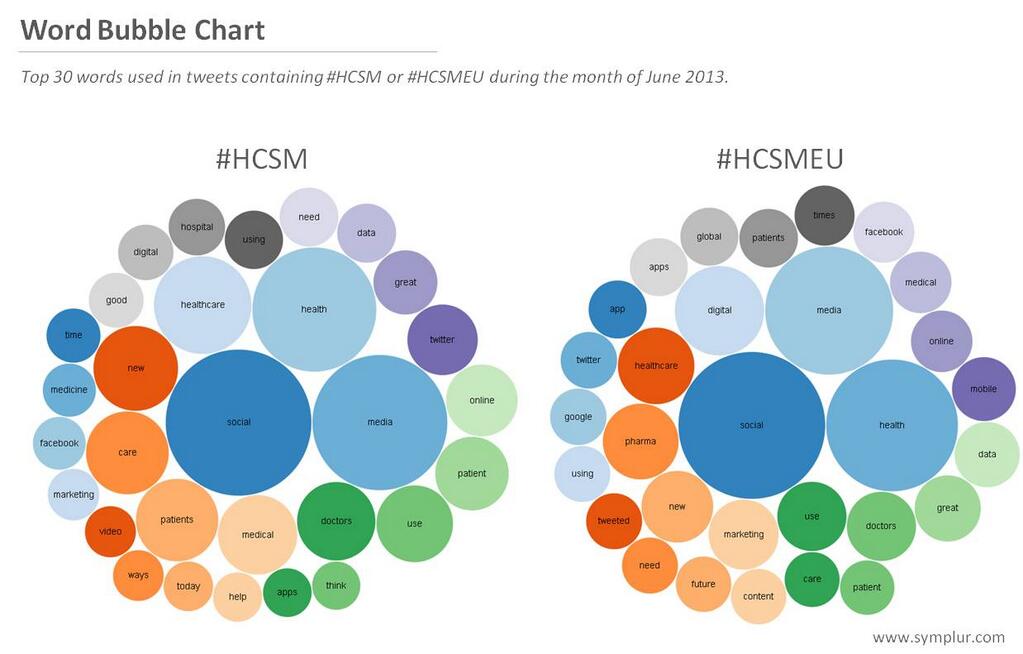
The green dots symbolizes patient centric topics, while pink encompasses more professional/provider topics. Larger bubbles signifies larger volume of conversations within that community. The data are visualized dynamically over a 2 year period.
Here’s what Symplur research uncovered:
What we discovered was somewhat of a surprise for some. From the start, many considered Twitter as a kind of virtual water cooler, mostly used by healthcare professionals. It’s been thought that the need for privacy would push patients to more closed platforms. Twitter as you know, is totally public and should not be considered private. However, from what you can clearly observe, the green bubbles have grown in numbers and significance quite dramatically in recent months. This indicates a strong growth of conversations in existing patient communities on Twitter and a strong growth of new patient communities on Twitter within our dataset.